
What this calculator includes
- Compare current and proposed revenue and contribution side by side.
- Include percentage payment fees and direct costs without counting them twice.
- Round required sales upward to whole completed sales.
- Check the required and expected sales against optional monthly capacity.
- Try preset scenarios or compare 5%, 10%, 15% and 20% changes.
- Choose USD, GBP, EUR, CAD, AUD or PKR labels. Currency selection does not convert amounts.
- Enter revised variable cost when materials, labor or fulfillment costs change.
- Find the maximum whole-sale loss that preserves the baseline, or the extra sales needed when costs rise too far.
How to use the price increase calculator for customer loss
Choose one consistent product, service or customer group that will receive the increase. Use completed sales for the same monthly period in both scenarios. If customers buy different amounts, estimate lost sales rather than the percentage of customer names.
- Enter your current selling price, direct variable cost per sale and percentage selling fee.
- Enter revised variable cost only if delivery costs will change. Leave it blank to keep current cost; entering zero deliberately sets the revised cost to zero.
- Add current completed monthly sales and your proposed price increase percentage.
- Estimate the percentage of completed sales you expect to lose after the increase.
- Add your available monthly capacity if known. Read minimum required sales and the contribution change together.
- Try a smaller or larger increase and compare it against your own retention assumptions. The tool cannot predict customer response.
Price increase and allowable customer-loss formula
Current contribution per sale = current price × (1 − fee rate) − current variable cost. New price = current price × (1 + increase rate). New contribution per sale = new price × (1 − fee rate) − revised variable cost.
Minimum required whole sales = round upward (current contribution per sale × current monthly sales ÷ new contribution per sale). Allowable whole-sale loss = current monthly sales − minimum required whole sales, when that difference is positive.
The tool calculates expected sales by rounding downward (current sales × (1 − expected loss rate)). Required sales are rounded upward because a partial completed sale cannot fund the baseline. If higher costs make required sales exceed the starting volume, the result shows additional sales needed instead of an allowable loss.
How many customers can you lose after a 10% price increase?
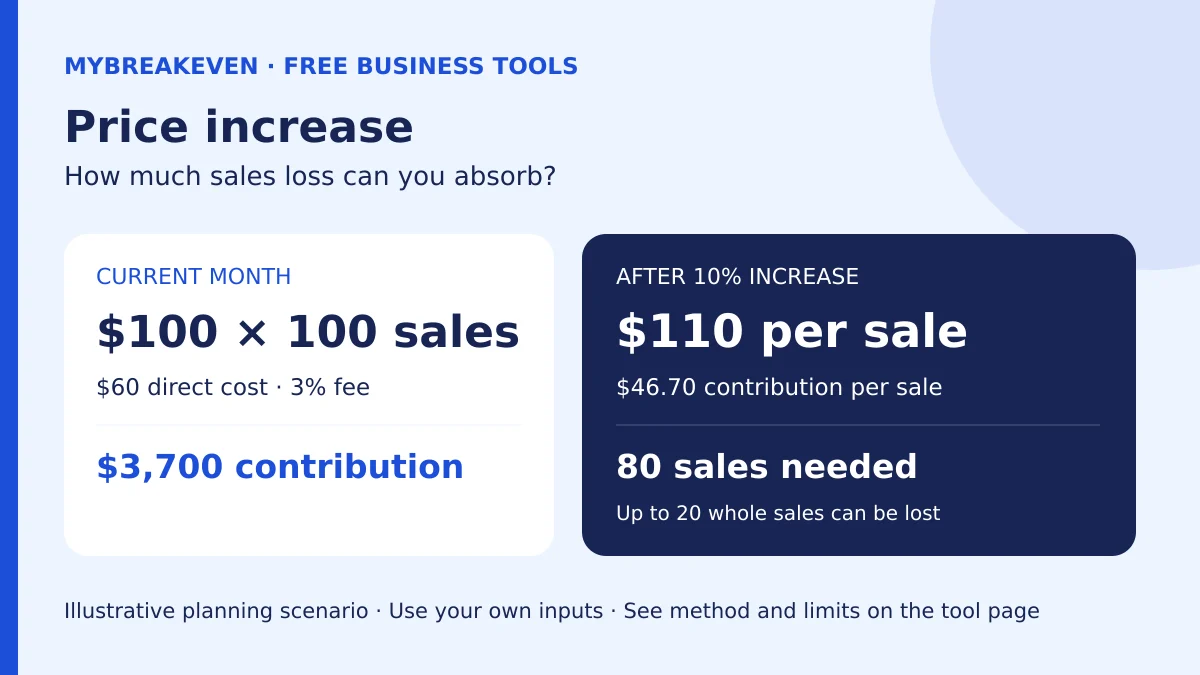
All figures below are illustrative planning assumptions. The starting service sale contributes $100 × 0.97 − $60 = $37. At 100 sales, monthly contribution is $3,700. Raising price to $110 leaves $110 × 0.97 − $60 = $46.70 per sale.
The exact target is $3,700 ÷ $46.70 = 79.2291… sales, so you need 80 completed sales. Losing 20 of the original 100 sales leaves $3,736 contribution, still $36 above the baseline. Losing 21 leaves 79 × $46.70 = $3,689.30, below the baseline.
| Scenario | New contribution per sale | Minimum whole sales | Expected contribution change |
|---|---|---|---|
| Service: $100 price, $60 cost, 3% fee; 100 sales; 10% increase, 10% loss | $46.70 | 80 (up to 20 lost) | +$503 at 90 sales |
| Retail: $50 price, $25 cost, 3% fee; 200 sales; 15% increase, 15% loss | $30.775 | 153 (up to 47 lost) | +$531.75 at 170 sales |
| Service: same baseline; 10% increase; revised cost $80, 10% loss | $26.70 | 139 (+39 required) | −$1,297 at 90 sales |
In the retail example, $57.50 price contributes $30.775 after fees and $25 direct cost. Baseline contribution is $4,700. At 170 expected sales, contribution becomes $5,231.75. The whole-sale recovery target is 153, allowing a loss of 47 sales, or 23.5% of the original 200.
A higher price does not protect contribution if delivery costs rise too far. In the third example, revised $80 cost leaves $26.70 contribution per sale. You need 139 sales to preserve $3,700, even though the price increased. At 90 expected sales, contribution is $2,403.
Understand revenue loss versus contribution after raising prices
In the default service example, 90 sales at $110 produce $9,900 revenue, down from $10,000. Contribution rises from $3,700 to $4,203 because each sale leaves more money after direct cost and fees. This is why revenue retention and contribution retention answer different questions.
The allowable loss applies to completed sales with comparable economics. It is a customer-loss threshold only when each customer represents the same number and type of sales. A high-value customer leaving can change the answer more than several small customers leaving.
The capacity check compares required and expected sales with the limit you enter. It does not prove demand, automatically cap the forecast or include fixed expansion costs. If the result requires extra staff, equipment or software, add those commitments to a full break-even plan.
Common mistakes when testing a business price increase
- Using lost customer count when customers have different order values. Model affected sales or comparable groups.
- Leaving revised cost blank even though fulfillment costs are rising.
- Treating higher revenue as proof of higher profit without checking contribution.
- Applying a price rise to new customers but modeling all existing sales at the new rate.
- Ignoring flat transaction charges or counting percentage fees twice.
- Treating allowable loss as predicted churn. The calculator gives a threshold based on your inputs.
Assumptions and limits
This compares one consistent product or service with an unchanged percentage fee. The discount model keeps variable cost unchanged; the price-increase model allows revised cost. Fixed overhead is assumed unchanged. Contribution funds overhead and owner pay; it is not net profit. Taxes and new monthly commitments are outside this comparison.
Sales lift and customer response are your assumptions. Capacity warnings do not cap the projection or prove demand. Required sales round upward; expected sales round downward. Money displays to two decimals while calculations retain precision. Use a separate scenario for a different product or customer group.
Frequently asked questions
How much customer loss can a 10% price increase absorb?
It depends on contribution before and after the increase, including fees and direct costs. In the worked service example, you can lose 20 of 100 completed sales. Use your own inputs; 20% is not a universal threshold.
Why can revenue fall while contribution rises?
Fewer higher-priced sales can leave more contribution per sale after delivery costs and fees. In the default example, revenue falls $100 while contribution rises $503. Monthly overhead still needs to be deducted.
Can I use this when supplier or labor costs rise?
Yes. Enter the changed cost in revised variable cost per sale. If revised contribution is lower than before, the tool may show that you need more sales despite the higher selling price.
Is customer loss the same as sales loss?
Only if customers represent comparable completed sales. For different order sizes or recurring frequencies, enter the percentage of sales lost or run separate customer-group scenarios.
Does the calculator recommend a safe price increase?
It shows the contribution threshold for the percentage you enter. It does not forecast churn, measure willingness to pay or recommend a guaranteed increase. Compare several scenarios with your actual retention evidence.
Does it include taxes, overhead and owner pay?
The comparison is before those monthly commitments. Enter price excluding sales tax collected for others. Use the full business break-even calculator for overhead, owner pay and a target profit.
Check the full monthly business target
Check whether your contribution can fund overhead, owner pay and your profit target, then compare the required sales with your available working capacity.
Build my full break-even plan →Explore Pro plan comparisonsPublished by MyBreakeven. Method and examples checked . Business calculation methodology · Report a calculation issue.