
Customer Profitability Analysis: Revenue, Cost to Serve and Decisions
Published by MyBreakeven. Editorial standards and corrections. Report a calculation or content issue to support@mybreakeven.com.
Measure customer profit with a reconciled cost-to-serve example. Separate avoidable costs, shared overhead and cash timing before changing an account.
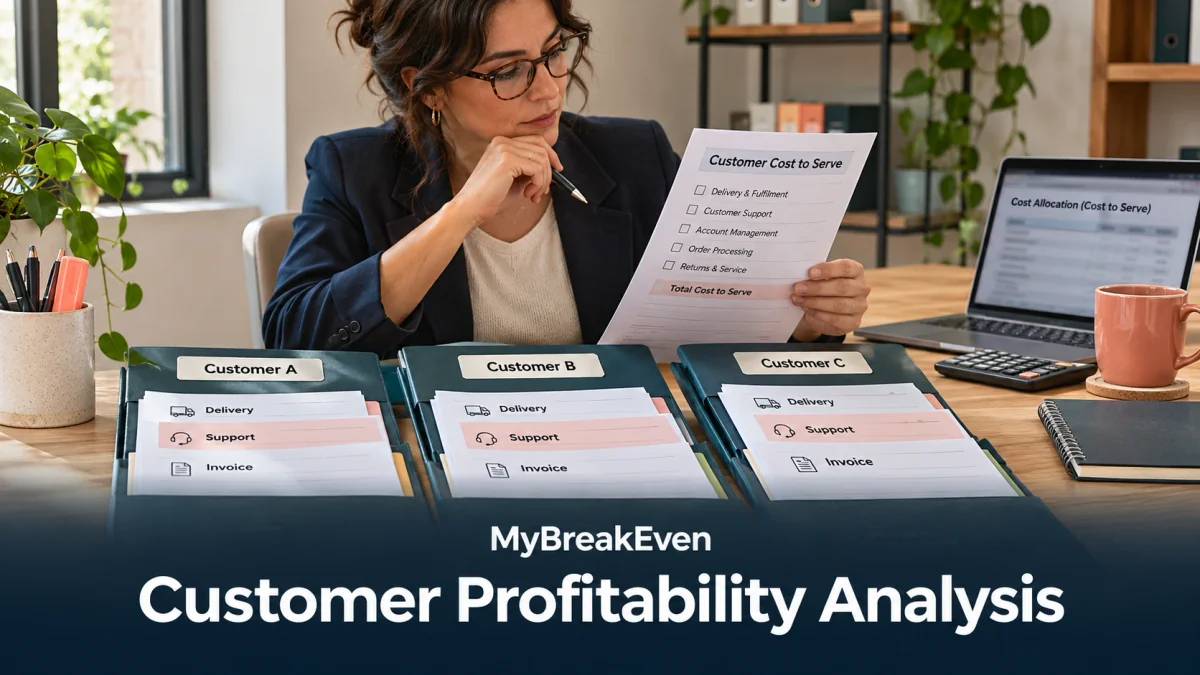
Customer profitability analysis compares a customer’s net revenue with the direct and shared costs of serving that customer during the same period. Show contribution and allocated profit separately before deciding whether a relationship should change.
Every amount in the worked case is an original fictional USD planning assumption. It is not an industry benchmark, a customer result or a prediction.
Define the period and the cost boundary
Start with a customer-month, quarter or year. Use earned revenue after discounts, credits and returns for that period. Keep collections in a separate dated view: an unpaid invoice can create accounting revenue without available cash. Define whether your result includes acquisition spending, account support, general overhead and owner work.
Customer contribution = net revenue − directly traceable delivery and service costs. Then subtract assigned shared service costs to obtain the specifically defined allocated result. Label the boundary; do not call a partially costed margin company net income. A customer’s lifetime value uses a different horizon and needs retention assumptions.
Reconcile three customers to the business total
| Measure | Customer A | Customer B | Customer C | Total |
|---|---|---|---|---|
| Net revenue | $6,000 | $4,000 | $2,000 | $12,000 |
| Direct delivery | $2,400 | $2,000 | $1,200 | $5,600 |
| Support hours | 10 | 20 | 30 | 60 |
| Support at $40/hour | $400 | $800 | $1,200 | $2,400 |
| Contribution after support | $3,200 | $1,200 | −$400 | $4,000 |
| General overhead allocated | $900 | $600 | $300 | $1,800 |
| Allocated result | $2,300 | $600 | −$700 | $2,200 |
The support pool is $2,400 divided by 60 practical support hours, giving $40 per hour. General overhead is allocated by revenue only to reconcile the remaining $1,800. Its allocation is a reporting choice, not evidence that the cash disappears when a customer leaves. Total revenue of $12,000 less $5,600 delivery, $2,400 support and $1,800 overhead equals $2,200.
Choose drivers that explain actual work
Use order lines for processing, support time for assistance, shipments for dispatch and documented collection effort for chasing overdue balances. Do not allocate every pool by sales simply because sales is available. Record the pool amount, source ledger, included activity, denominator and each customer’s usage. The sum of allocations must equal the amount assigned; idle capacity or unassigned overhead should remain visible.
For acquisition cost, choose and disclose a treatment. Expensing all campaign spend in the acquisition month may be useful for that month’s result; spreading it over an assumed relationship produces a different managerial measure. Neither choice should silently mix lifetime acquisition cost with one month’s revenue.
Test an action instead of automatically dropping the customer
Customer C looks loss-making after allocation. Suppose a standard-order policy removes ten support hours. At the chosen $40 rate, the ledger shows $400 less assigned support and a zero contribution after support. But if salaried staff are still paid, near-term cash does not improve by $400. Instead, released hours may let the same team serve better work.
Before repricing or exiting, list contract commitments, collection risk, rework, spare capacity and costs genuinely avoided. Compare a scoped service level, paid rush requests, minimum order or staged price change with the current account. A negative allocated result is a reason to investigate, not an automatic customer termination rule.
Build a monthly account review that can be audited
- Reconcile customer net revenue to the sales ledger.
- Trace delivery, refunds and customer-specific effort from source records.
- Allocate only identified service pools using documented drivers.
- Show unassigned overhead and reconcile the complete business result.
- Choose an action, name an owner and review the next period’s actuals.
Use the agency client profitability guide for a service-account application, and the cleaning contract profit calculator for a contract-specific cost boundary. Check those records against the broader contribution income statement.
Use the worksheet with your own records
Download the printable, editable HTML worksheet. It contains the completed example and a blank table. Open it in a browser, edit the blank fields, calculate the outputs using the stated method and print to PDF or paper. It does not automatically calculate results or replace your accounting records.
Method references and source notes
The method references below support the definitions. The examples, assumptions and decision checks on this page are independently constructed.
Frequently asked questions
Is a high-revenue customer always profitable?
No. Discounts, delivery effort, exceptions, support and collection work can consume the apparent margin. Compare consistently costed results for the same period.
Should shared overhead determine whether to drop a customer?
Not by itself. Test avoidable costs and released capacity; allocated overhead may remain after the account leaves.
Which cost driver should I use?
Choose a documented measure that explains the activity, such as support hours or shipments. Reconcile the allocated pool and show any unassigned cost.
Can profit be positive while collections are late?
Yes. Accrual revenue and customer contribution do not establish available cash. Track invoice due dates and receipts separately.
Browse the MyBreakeven blog hub for related planning guides.
Planning estimates only—not accounting, tax, legal or lending advice.