
Cost Volume Profit Analysis: Break-Even, Target Profit and Capacity
Published by MyBreakeven. Editorial standards and corrections. Report a calculation or content issue to support@mybreakeven.com.
Test price, costs, volume, sales mix and capacity with CVP analysis. Reconcile break-even and target profit before accepting a higher fixed-cost commitment.
Cost-volume-profit analysis tests how price, variable costs, fixed costs and sold volume combine to produce operating profit. Break-even is its zero-profit case; the useful business decision also checks demand, product mix and the capacity range.
Every amount in the worked case is an original fictional USD planning assumption. It is not an industry benchmark, a customer result or a prediction.
Start with one consistent unit and cost boundary
Operating profit = units × (net price − variable cost per unit) − fixed operating costs. Contribution per unit is net price less variable cost. The contribution ratio divides that contribution by price. Break-even units equal fixed costs divided by positive unit contribution. Required units for a profit target equal (fixed costs + target operating profit) divided by unit contribution.
If contribution is zero or negative, selling more of the unchanged offer does not cover positive fixed costs. Keep every amount in the same period and currency. Owner wages included in fixed costs must not be added again as a separate profit goal. Drawings and financing require separate cash treatment.
Reconcile the profit at several volumes
| Sold units | Sales | Variable cost | Contribution | Operating profit |
|---|---|---|---|---|
| 150 | $18,000 | $10,800 | $7,200 | −$2,400 |
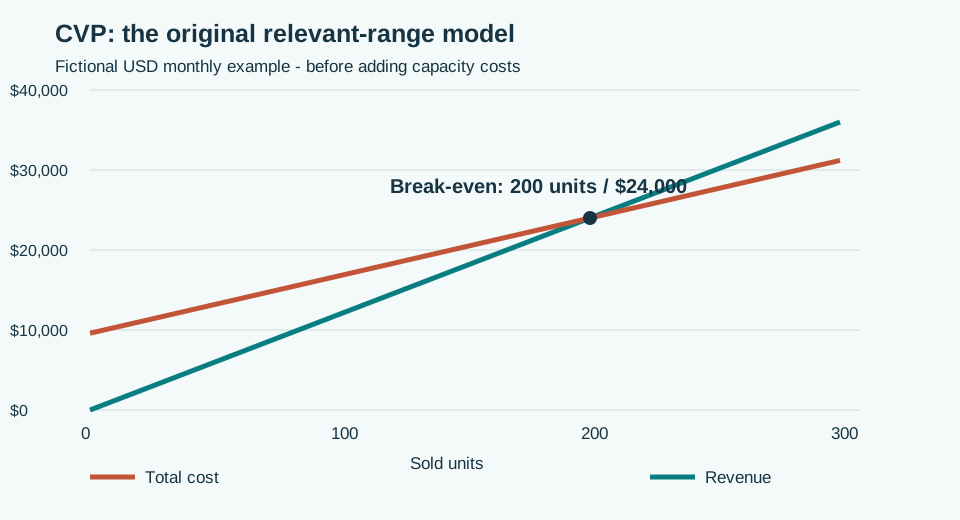
| 200 | $24,000 | $14,400 | $9,600 | $0 |
| 250 | $30,000 | $18,000 | $12,000 | $2,400 |
| 300 | $36,000 | $21,600 | $14,400 | $4,800 |
Unit contribution is $48, the contribution ratio is 40%, and exact break-even is 200 units or $24,000. A $4,800 operating-profit target requires 300 units. A $5,000 target would require 304.1667 units mathematically; 305 whole units produce $5,040 profit under the unchanged assumptions.
Check the capacity step before trusting the target
Suppose existing resources can deliver only 260 units. Selling 300 requires another $2,400 monthly capacity commitment. The fixed-cost base becomes $12,000 and 300 units now produce $2,400, not $4,800. To recover the original $4,800 target at the same price and variable rate requires 350 units. That second target also needs its own capacity and demand check.
A discounted price of $110 leaves only $38 contribution at the original $72 variable rate. With the original $9,600 fixed base, break-even becomes 252.6316 exact units, or 253 whole units. These comparisons isolate a changed assumption; combining them without rebuilding the full model would misstate the answer.
A sales mix changes what an average unit means
For two offers contributing $40 and $70 per unit, a 3:2 unit mix creates a five-unit bundle with $260 contribution. At $10,400 fixed cost, break-even is 40 bundles: 120 units of the first offer and 80 of the second. The weighted unit contribution is $52. If the mix changes, that average no longer applies.
Use the existing multiple-product break-even guide for the mix calculation. The contribution income statement reconciles cost behavior; the target-profit guide owns the detailed units-and-sales task.
Know when the straight-line model stops answering the question
Simple CVP assumes stable price and variable cost per unit, a relevant fixed-cost range, meaningful cost classification and a stated mix. Inventory changes, capacity tiers, waste, payment fees and channel commissions can require a more detailed model. Profit is not available cash: collection delays, inventory purchases, debt principal and capital expenditure must also be scheduled.
Use flexible budget variance analysis to compare actual performance at actual volume rather than blaming a revenue shortfall on cost control. Treat a feasible profit target as a plan to test, not proof that buyers will order it.
Use the worksheet with your own records
Download the printable, editable HTML worksheet. It contains the completed example and a blank table. Open it in a browser, edit the blank fields, calculate the outputs using the stated method and print to PDF or paper. It does not automatically calculate results or replace your accounting records.
Method references and source notes
The method references below support the definitions. The examples, assumptions and decision checks on this page are independently constructed.
Frequently asked questions
Is CVP the same as break-even analysis?
Break-even is the zero-profit case within CVP. CVP also compares target profits and changes in volume, price, costs and mix.
Why can a correct target still fail?
It may exceed capacity, rely on unsupported demand or cross a fixed-cost step. A profit model also does not establish cash availability.
What if contribution per unit is negative?
With the same price and variable rate, additional units deepen the contribution shortfall. Resolve the economics before dividing fixed costs by contribution.
Why does the product mix matter?
Each offer can contribute a different amount. The weighted contribution is valid only for the stated mix and cost range.
Browse the MyBreakeven blog hub for related planning guides.
Planning estimates only—not accounting, tax, legal or lending advice.