
ROAS vs ROI: Follow One Campaign from Revenue to Profit
Published by MyBreakeven. Editorial standards and corrections. Report a calculation or content issue to support@mybreakeven.com.
Compare ROAS and ROI using one campaign ledger. Include refunds, product costs and creative fees, and state the investment denominator before comparing returns.
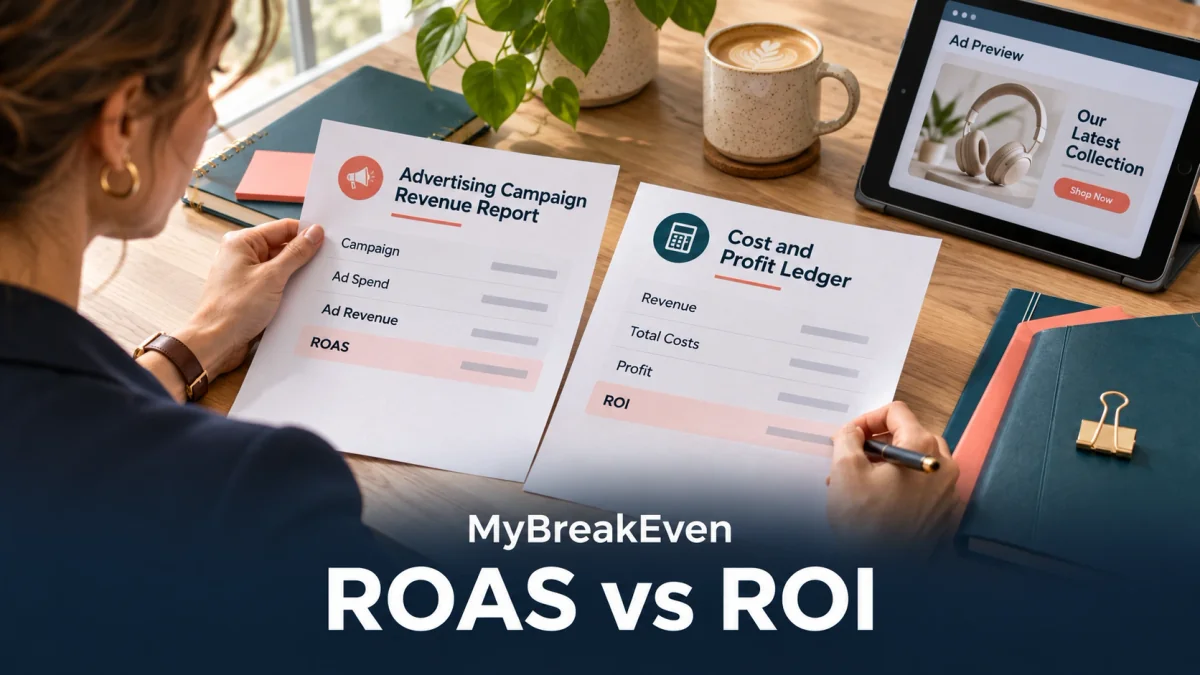
ROAS divides attributed conversion revenue by ad spend. ROI compares a defined net profit with a defined investment cost. A high ROAS can coexist with a loss when product, fulfillment, refunds and campaign costs absorb the revenue.
Every amount in the worked case is an original fictional USD planning assumption. It is not an industry benchmark, a customer result or a prediction.
Write both formulas and state what each includes
ROAS = attributed conversion revenue ÷ advertising spend. A 4× result means $4 attributed revenue for each $1 of media spend; it is not $4 profit. Where a platform tracks non-revenue conversion value, call the metric conversion-value ROAS rather than cash sales.
ROI = net return ÷ defined investment cost × 100%. Net return subtracts the costs included in that definition. Some teams report campaign profit divided by media/marketing investment; others divide by all included costs. Both can be interpretable, but only if the numerator and denominator are explicit and comparable.
Work through one completed campaign
| Ledger item | Amount | Treatment |
|---|---|---|
| Net attributed revenue | $12,000 | After credits/returns in this example |
| Ad spend | $3,000 | Media only |
| Product costs | $5,400 | Cost of fulfilled sales |
| Fulfillment and transaction fees | $1,800 | Additional sale-linked costs |
| Creative and campaign support | $1,200 | Separate from media |
| Included total cost | $11,400 | Sum of all four cost lines |
| Profit after included costs | $600 | $12,000 − $11,400 |
ROAS is $12,000 ÷ $3,000 = 4×, or 400%. Total-cost ROI is $600 ÷ $11,400 = 5.26%. A separately labelled marketing-investment return is $600 ÷ ($3,000 + $1,200) = 14.29%. The different percentages do not conflict: their cost bases differ. The case excludes general company overhead, interest and tax, so $600 is not represented as company net income.
Find the threshold implied by this exact ledger
Product and fulfillment costs total $7,200, or 60% of net revenue. The pre-marketing contribution ratio is 40%. Ignoring the separate creative/support cost, media-only break-even ROAS is 1 ÷ 0.40 = 2.5×. Including $1,200 creative/support and holding $3,000 media spend fixed requires revenue of ($3,000 + $1,200) ÷ 0.40 = $10,500, or 3.5× media ROAS.
This threshold assumes a stable cost ratio, net revenue definition and campaign support budget. If returns, order mix or fulfillment rates change, recalculate. Use the existing break-even ROAS calculator and its formula explanation for the threshold task rather than creating a second ROAS tool.
Keep the sales result constant and change the economics
If fulfillment and fees increase by $900, profit falls from $600 to −$300 while ROAS remains 4×. Included costs become $12,300 and total-cost ROI becomes −2.44%. That is why creative changes that raise revenue can still damage profit when they also increase discounts, returns or expensive deliveries.
Track net revenue, contribution before media, campaign profit and cash settlement together. Compare cohorts only after a consistent conversion/return window. An order reported today may be returned later, and a payment processor can settle cash on another date.
Do not turn attribution into proof of incremental sales
Attributed conversions follow a platform’s measurement model. They do not establish how many sales would have happened without advertising. Separate branded/returning-customer attribution from a documented incrementality test. Do not combine overlapping platform revenue totals as though every order were unique.
Before increasing spend, verify currency, revenue events, refunds, attribution windows, cost imports and the investment definition. Review ecommerce unit economics and the business ROI calculator when the decision includes more than advertising.
Use the worksheet with your own records
Download the printable, editable HTML worksheet. It contains the completed example and a blank table. Open it in a browser, edit the blank fields, calculate the outputs using the stated method and print to PDF or paper. It does not automatically calculate results or replace your accounting records.
Method references and source notes
The method references below support the definitions. The examples, assumptions and decision checks on this page are independently constructed.
Frequently asked questions
Is 400% ROAS the same as 400% ROI?
No. A 400% ROAS is 4× attributed value divided by media spend. ROI uses net return and a separately defined investment denominator.
Which result should I use for scaling?
Review contribution and campaign profit, attribution quality, capacity and cash timing together. A revenue ratio alone does not establish profitable incremental growth.
Should refunds change the revenue input?
Use a consistently defined net revenue measure and a matched return window. Do not subtract a refund again if it is already netted in the input.
Does reported ROAS prove advertising caused the sales?
No. Attribution assigns credit under a model. Incrementality requires evidence about sales that would not have happened without the campaign.
Browse the MyBreakeven blog hub for related planning guides.
Planning estimates only—not accounting, tax, legal or lending advice.