
Business Growth Strategies: Compare Contribution, Capacity and Cash
Published by MyBreakeven. Editorial standards and corrections. Report a calculation or content issue to support@mybreakeven.com.
Compare retention, pricing, added volume and channel growth with original financial cases. Test contribution, bottlenecks and funding before committing.

A business growth strategy should explain which customers and offers will generate more useful contribution, what capacity is required and how the change will be funded before cash arrives. Higher sales alone do not establish a better or affordable business.
All business names, amounts and operating results in the worked examples are fictional teaching assumptions in USD. They are not industry averages, actual customer results or forecasts for your business.
Choose a growth mechanism before choosing a spending budget
| Option | Evidence needed | Cost or constraint to test |
|---|---|---|
| Retain existing customers | Repeat purchase and churn records | Support effort and retention incentives |
| Improve price or scope | Buyer acceptance and offer comparison | Lost volume and delivery changes |
| Sell more through the current channel | Conversion and demand records | Acquisition cost and practical capacity |
| Add a channel or segment | Pilot with separately tracked economics | Fees, returns and collections |
| Add an offer for existing buyers | Problem and willingness-to-pay evidence | Development, training and complexity |
| Increase delivery capacity | Verified backlog and bottleneck | Fixed commitments and ramp-up cash |
Compare options using the same period and cost boundary. A discount may increase orders while lowering total contribution. A new channel may bring demand but add commissions or slower settlement. Retention can reduce replacement selling effort, but it still needs a defined offer and service budget. Test the actual mechanism rather than applying a generic growth percentage.
Compare price, volume and capacity in one fictional business
| Case | Jobs / price | Revenue | Contribution | Overhead | Result |
|---|---|---|---|---|---|
| Baseline | 100 / $200 | $20,000 | $10,000 | $6,000 | $4,000 |
| Price +5%, same volume | 100 / $210 | $21,000 | $11,000 | $6,000 | $5,000 |
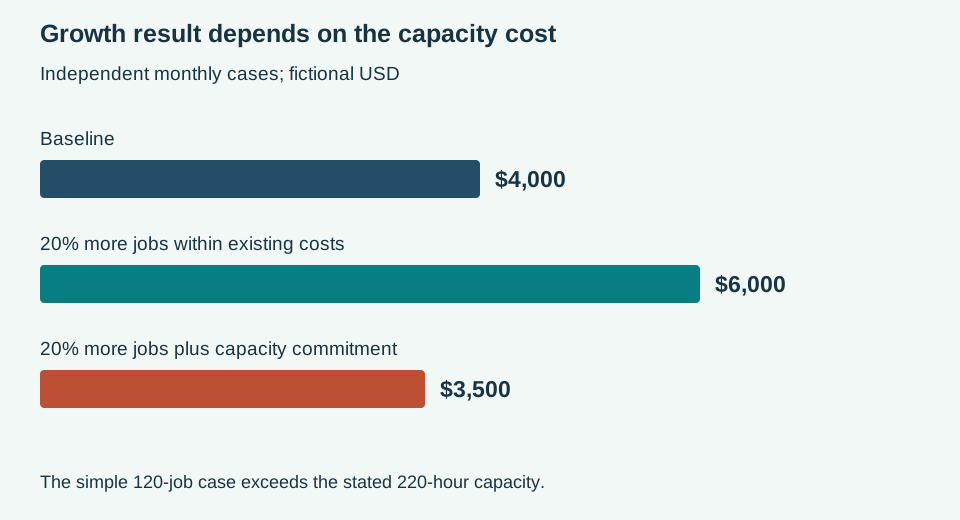
| Volume +20%, same costs | 120 / $200 | $24,000 | $12,000 | $6,000 | $6,000 |
| Volume +20%, new capacity cost | 120 / $200 | $24,000 | $12,000 | $8,500 | $3,500 |
Each job takes two worker-hours. Baseline work requires 200 hours; 120 jobs require 240. If practical capacity is 220, the simple volume case is infeasible without a resource or scope change. The last case assumes a specific $2,500 added monthly commitment and adequate capacity, showing a result below baseline despite higher sales. The price case assumes no volume loss solely to isolate the price effect; customer acceptance still needs evidence.
Fund the ramp before treating the result as available cash
Suppose the extra 20 jobs require $2,000 additional delivery payments before customer cash clears. A $1,000 campaign payment and $2,500 capacity payment are also due before those receipts. The incremental pre-collection cash requirement is $5,500, before fees, timing differences or a chosen reserve. This is a cash schedule, not another $5,500 expense to subtract from the monthly result: some costs are already in the case.
Map every incremental receipt and payment to a date. Distinguish a one-time setup purchase from a recurring capacity commitment. Test customer payment delays and the period after a promotion ends. Review the financial contingency plan for triggers if the growth assumptions fail.
Set limits and compare a pilot with its original case
Choose one offer, channel or segment for the first test. Record incremental acquisition spending, accepted price, realized delivery hours, refund or rework costs and collection dates. Keep comparable existing activity visible: a new channel can shift customers from an existing channel rather than create entirely new demand.
Set an exposure ceiling, review date and response to missed assumptions before launching the test. For example, investigate if delivery rises above the planned two hours or if additional sales require capacity earlier than expected. Those are case-specific controls. Do not claim a pilot caused all extra sales without a defensible comparison.
Decide using profit, bottlenecks and cash together
Approve a next step only when the demand evidence, defined contribution, operational plan and dated cash schedule reconcile. List commitments that cannot be reversed quickly and verify funding conditions. A positive forecast under an unapproved staffing plan is still an unresolved decision.
Use CVP scenarios for cost ranges, the sales forecast for demand and capacity, and ROAS versus ROI when evaluating a paid campaign. Link growth choices to an archived operating forecast so the next review can explain what actually changed.
Translate an approved growth choice into measurable business goals, and record the resource trade-off in the strategic plan.
Download the editable decision record
Download the printable HTML worksheet. It includes the completed case and blank fields for your evidence, assumptions, dates and decision. It does not calculate automatically. Edits stay in the open browser until you print or save your completed copy; keep your original separately.
Sources and method
The linked sources support the general framework. The calculations, operating constraints and decision examples here are original MyBreakEven teaching material.
Frequently asked questions
Can more revenue reduce profit?
Yes. Additional fixed commitments, weaker prices, delivery costs or channel costs can outweigh the extra contribution.
Should I spend more on ads first?
Identify the growth mechanism and current bottleneck first. Additional demand may create a capacity or cash problem rather than a better result.
Does the price scenario predict a 5% increase will work?
No. It holds volume constant to isolate arithmetic. Actual willingness to pay and retention need evidence.
How should I compare growth options?
Use matching periods and cost boundaries, then check demand evidence, practical capacity, cash dates and downside exposure.
Browse the MyBreakeven blog hub for related planning guides.
Planning estimates only—not accounting, tax, legal or lending advice.